In a previous post, we detailed how the seqmc action can be used to mine frequent sequences. In this post, we investigate an alternative algorithm used to identify the most frequently occurring sequences. The cspade algorithm uses a vertical id-list database format that minimizes I/O costs by reducing database scans and effective lattice search techniques to minimize computational costs. The cspade action incorporates syntactic constraints on the mined sequences. These take the form of length or width limitations on the sequences, minimum or maximum gap constraints on consecutive sequence elements, applying a time window on allowable sequences, and incorporating item constraints. It is an efficient algorithm for mining frequent sequences with user-given constraint parameters. Let's look at the example of DNA sequence to illustrate cspade usage.
Domain Background (DNA sequence)
The genome of an organism is the total sum of its entire genetic potential, stored as an encoded sequence consisting of four nucleotide bases (Adenine-A, Guanine- G, Cytosine-C, and Thymine-T) that make up its nucleic acids. In a broad sense, the term "genotype" refers to the genetic makeup of an organism. So it describes an organism's complete set of genes. In a narrower sense, the term can be used to refer to the alleles, or variant forms of a gene, that are carried by an organism.
In this example, we will take a closer look at the COVID-19 genotype by analyzing its markers. A genetic marker is a gene or DNA sequence with a known location on a chromosome. Genetic markers can be used to identify individuals or genotypes. We can classify the COVID-19 variant based on its markers. We are given genotype markers that are used to discriminate most of the randomly selected genotype pairs. Our task is to identify the characteristics (sequence patterns) that they all share. Using the sequence analysis, we can try to identify the most commonly occurring patterns in the markers that appear in the different COVID-19 genotypes.
We have a data set that contains the names of the COVID-19 markers and their corresponding gene sequence. In total, there are 24 markers. For example, BRIS_CoV_313 is the name of the COVID-19 marker described by this sequence: NNNATGGAGAGCCTTGTCCCTGGTTTCAACGAGAAAACACACGTCCAACT[C/T]AGTTTGCCTGTTTTACAGGTTCGCGACGTGCTCGTACGTGGCTTTGGAG.
The goal is the identification of characteristics that help biomedical experts to produce hypotheses about the effect of these characteristics on the disease manifestations in the population. This process, however, is often very slow and resource intensive, and it largely depends on domain expertise. The use of methods like cspade has the potential to accelerate the process of finding actionable insights and eventually contribute to a better global response.
Algorithm background (cspade)
A sequence is n-length if it is defined by a set consisting of n items. For example, an itemset contains either one item or multiple items and is defined by size. So, if the size is three, the itemset contains only three items.
Given a sequence of NNNATG, where every base is indexed by its location or position, the window size is defined as the difference in the position of the last item G and that of the first item N. In this sequence, it is five.
A crucial parameter is called “support." It extracts the frequent sequences. Conceptually, the constraints filter the output based on their values. Support is defined as the proportion of examples (markers) that contain the particular output sequence. In our context, there are a total of 24 markers. If a sequence GTTCTT appears in all 24 markers, then the support for that sequence is 1 (100%). If it occurs only in 12 markers, then the support would be 12/24, which is 0.5 (50%). The support parameter also acts as a filter if we extend the logic. It filters those sequences that have support more than minSupport from all possible combinations of sequences.
Data preprocessing
The cspade action needs the following three variables. The first contains sequenceID (marker sequence), the second contains eventID (position, location), and the third contains itemID (bases A, T, C, and G).
Inputs need to be numeric and arranged in ascending order of sequenceID and eventID. They should not contain any missing values. Therefore, we further need to code map bases A, C, T, G, etc. into 1, 2, 3, 4, and so on, respectively, as shown in Table 1.
| Bases in Data | Mapped values |
| A | 1 |
| C | 2 |
| G | 3 |
| K | 4 |
| N | 5 |
| R | 6 |
| S | 7 |
| T | 8 |
| W | 9 |
| Y | 10 |
Table 1: Map used to preprocess input data (refer to program). To learn more about notation, refer to Wikipedia.
CAS Action program
With all this information, let’s see how we can exploit the cspade action in the Sequence Rule Mining action set to arrive at a solution. That is, we want to find the frequent patterns in any marker that affect the manifestation of disease. We run the data preprocessing program which converts the data set into cspade compatible format by applying the map in Table 1.
After the preprocessing of the data, we then run the cspade program (Program 1) as:
proc cas; loadactionset "sequence"; sequence.cspade / table="sequence", casout="seqout", itemID="basen", eventID="position", sequenceID="marker", support = 0.4; run; quit; |
Here we have used 0.4 as the support value, which is just indicative. It means we want to find the sequence patterns that occur in more than 40% of the total markers we have. The higher the support, the higher its predictive power. Higher support indicates how strongly a particular subsequence or sequence pattern contributes to the manifestation of a certain disease.
Interpreting output (seqout):
Table 2 lists the summary of the output generated by the cspade action.
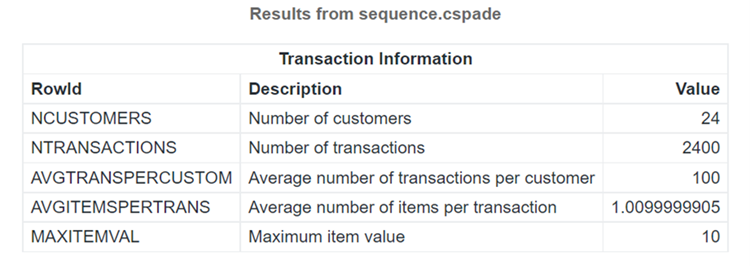
The data set contains 24 sequences (markers) in all. The total number of transactions, meaning unique sequenceID, eventID pairs, is 2400. Every sequence has 100 positions on average. Every transaction has approximately one item. The last one is the maximum item value, which in our case is 10. (Please refer to this program.)
Table 3 shows the output data set generated by the casout= parameter.
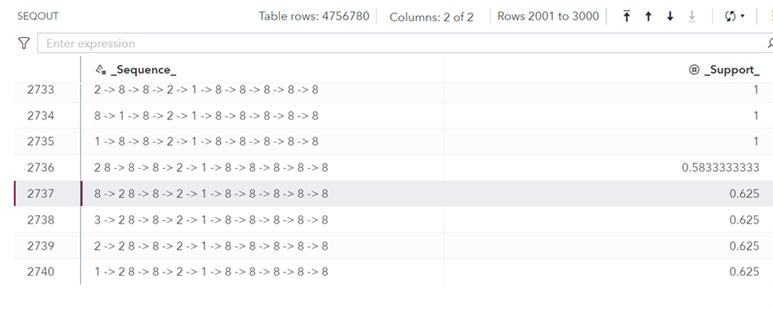
The output data set seqout contains a total of 4756780 sequences! It has two columns. Column _Sequence_ contains the frequent sequence identified, whereas column _Support_ contains its support value. For example, the sequence in row number 2737, which is, 8->2 8 ->8->2->1->8->8->8->8->8 occurs in 62.5% of the input sequences. This sequence, after removing the map in Table 1, translates into T[CT]TCATTTTT.
Summary
The sequence action set provides algorithms with different capabilities, including the seqmc action discussed in the previous blog. The exact methods such as the cspade action should be preferred when you is interested in finding all the sequences that affect the analysis. Cspade is able to handle large data sets. However, it might take much longer and in some cases be impossible to write all possible sequences, when compared against seqmc. The run time of cspade increases exponentially with the length of the sequence. In such cases, we have to resort to seqmc, which is based on Monte Carlo sampling and is very fast. Constraints in cspade, which act as filters, can be used to limit the size of the problem. These constraints greatly reduce the search space and enable you to focus only on sequences meeting characteristics of interest.